OnlineMaths.org
Home
JC Exam Papers
Glossary
Unifying Strand
CBA1
Number
Natural Numbers
Indices
Sets
Applied Arithmetic & Measure
Geometry & Trigonometry
Geometry Concepts, Axioms & Terms
Geometry Theorems & Corollaries
Theorem Proofs
Constructions
Coordinate Geometry
Trigonometry
Statistics & Probability
Statistics
Probability
Algebra & Functions
Evaluate Expressions
Add, Subtract & Multiply
Solving Linear Equations
Factorising
Algebraic Fractions & Division
Rearranging Formulae
Solving Word Problems
Solving Inequalities
Simultaneous Equations
Quadratic Equations
Functions
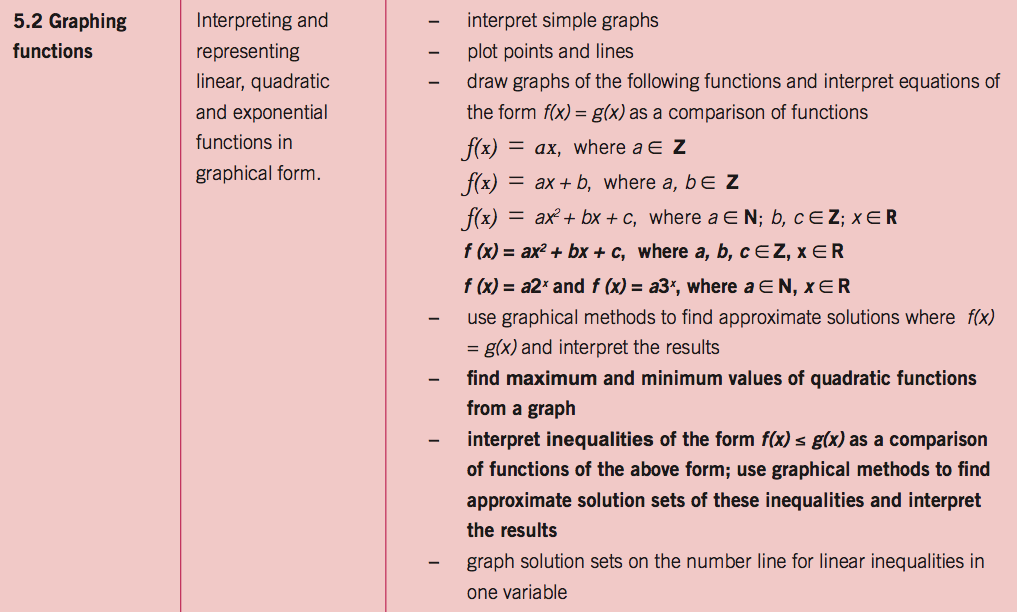
Graphing Functions
Graphing Functions